
Refind Realty Blog
Job Growth vs. Home Prices: A 10-Year DFW Correlation Study | Refind Realty DFW
The Correlation Between DFW Job Growth and Median Home Prices: A 10-Year Study

Direct Answer
Over the past decade (2016–2026), the DFW housing market has demonstrated a strong positive correlation between job creation and home value appreciation, though this link has softened in the last 24 months. Between 2015 and 2025, home prices in cities like Fort Worth rose by a staggering 127%, fueled by a diversified economy that added tens of thousands of jobs annually in sectors like professional services, logistics, and tech. However, in early 2026, while the labor market remains resilient with 130,000 jobs added in January nationwide, median home prices in DFW have dipped by approximately 2.47% year-over-year as inventory hits decade-highs and affordability constraints outpace wage growth.
Book your Home Goals consultation to see how current job trends in your industry affect your DFW home value: https<span></span>://stevenjthomas.com/home-goals
1. A Decade of Data: The Job-to-Price Engine
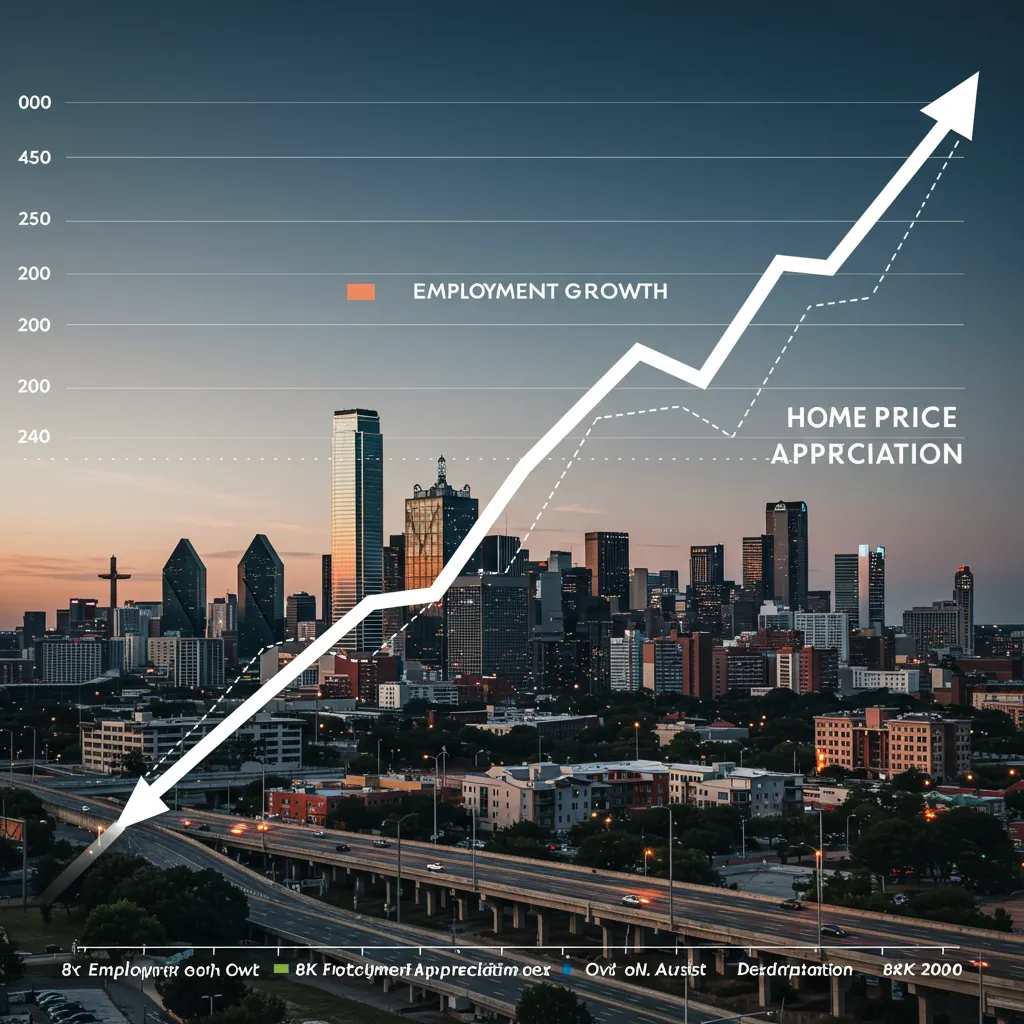
The 10-year historical trend shows that when DFW outpaces national job growth, home prices inevitably follow.
Expansion Phase (2013–2019): During this period, North Texas added an average of 23,600 jobs annually. Home prices responded with steady, healthy appreciation as service-providing sectors accounted for 88% of this growth.
The Hyper-Growth Spike (2020–2022): Pandemic-era migration and low interest rates caused a "gold rush," with home prices increasing 40% in just two years.
Long-Term Equity: From 2015 to 2025, the average annual appreciation in Fort Worth was 8.57%, placing it in the top 20% of U.S. cities for housing value growth.
2. 2026: The Affordability Gap
Despite continued modest job growth in early 2026, the correlation has encountered an "affordability ceiling".
Wage vs. Price: Homebuyers in DFW now need to earn 48% more than they did just six years ago to purchase the same median-priced home.
Inventory Shifts: For the first time since 2012, inventory has climbed to 4.7 months of supply. This shift is moving DFW from an overheated seller's market toward a balanced environment where buyers have more leverage.
The "Lock-In" Effect: Stability is currently maintained by homeowners anchored to ultra-low rates from earlier in the decade, which limits the number of new listings and prevents a sharp price crash.
3. Sector Breakdown: Who is Buying in 2026?
The types of jobs being created in 2026 are shifting, which in turn shifts the "who and where" of home buying.
Healthcare & Social Assistance: This sector led January 2026 growth with 123,500 jobs. This workforce typically seeks stability in established "Mid-Cities" or suburban hubs.
Construction & Technical Services: These sectors added a combined 60,000+ jobs in January, continuing to fuel demand for new construction in the northern DFW corridors.
Modest Outlook: While job gains exceeded expectations in early 2026, the 12-month average monthly gain has slowed to 30,000 jobs, down from 103,000 in early 2025.
Conclusion
The 10-year study of the DFW market proves that while job growth is the foundation of housing demand, it is not a guarantee of perpetual price hikes. In 2026, we are seeing the market "digest" the massive gains of the last decade. For sellers, this means pricing strategically is now mandatory. For buyers, the 2026 rebalance provides a rare window where job-driven stability remains high, but the "bidding war" frenzy has finally cooled.
Key Takeaways
10-Year Growth: Median prices in North Texas more than doubled between 2015 and 2025.
2026 Stability: The market is normalizing, with median listing prices currently around $390,125, a slight 2.47% decrease year-over-year.
Inventory Peak: DFW has reached its highest available housing supply since the early 2010s.
Resilient Labor: Employment continues to grow in Construction and Healthcare, providing a backstop against significant price declines.

BLOG NAVIGATION
Contact Me By Filling Out
The Form Below
We Can Help You Reach Your Real Estate Goals!
Get In Touch With Me
Office 1229 E. Pleasant Run Ste 224, DeSoto TX 75115
Call :(713) 505-2280
Email: [email protected]
Site: www.stevenjthomas.com
Facebook
Instagram
X
LinkedIn
Youtube
TikTok